Back in February, I calculated an update to the Category IIB percentiles we used to publish in our Factbook. That post is here.
The AAUP has now posted data for the 2018-19 academic year. This year includes both the recent rounds of raises in January 2017 (in effect for the last half of 2016-17, although I don’t think that our AAUP salary reporting included the raises until 2017-18) and August 2018 (in effect presumably for the 2018-19 reporting).
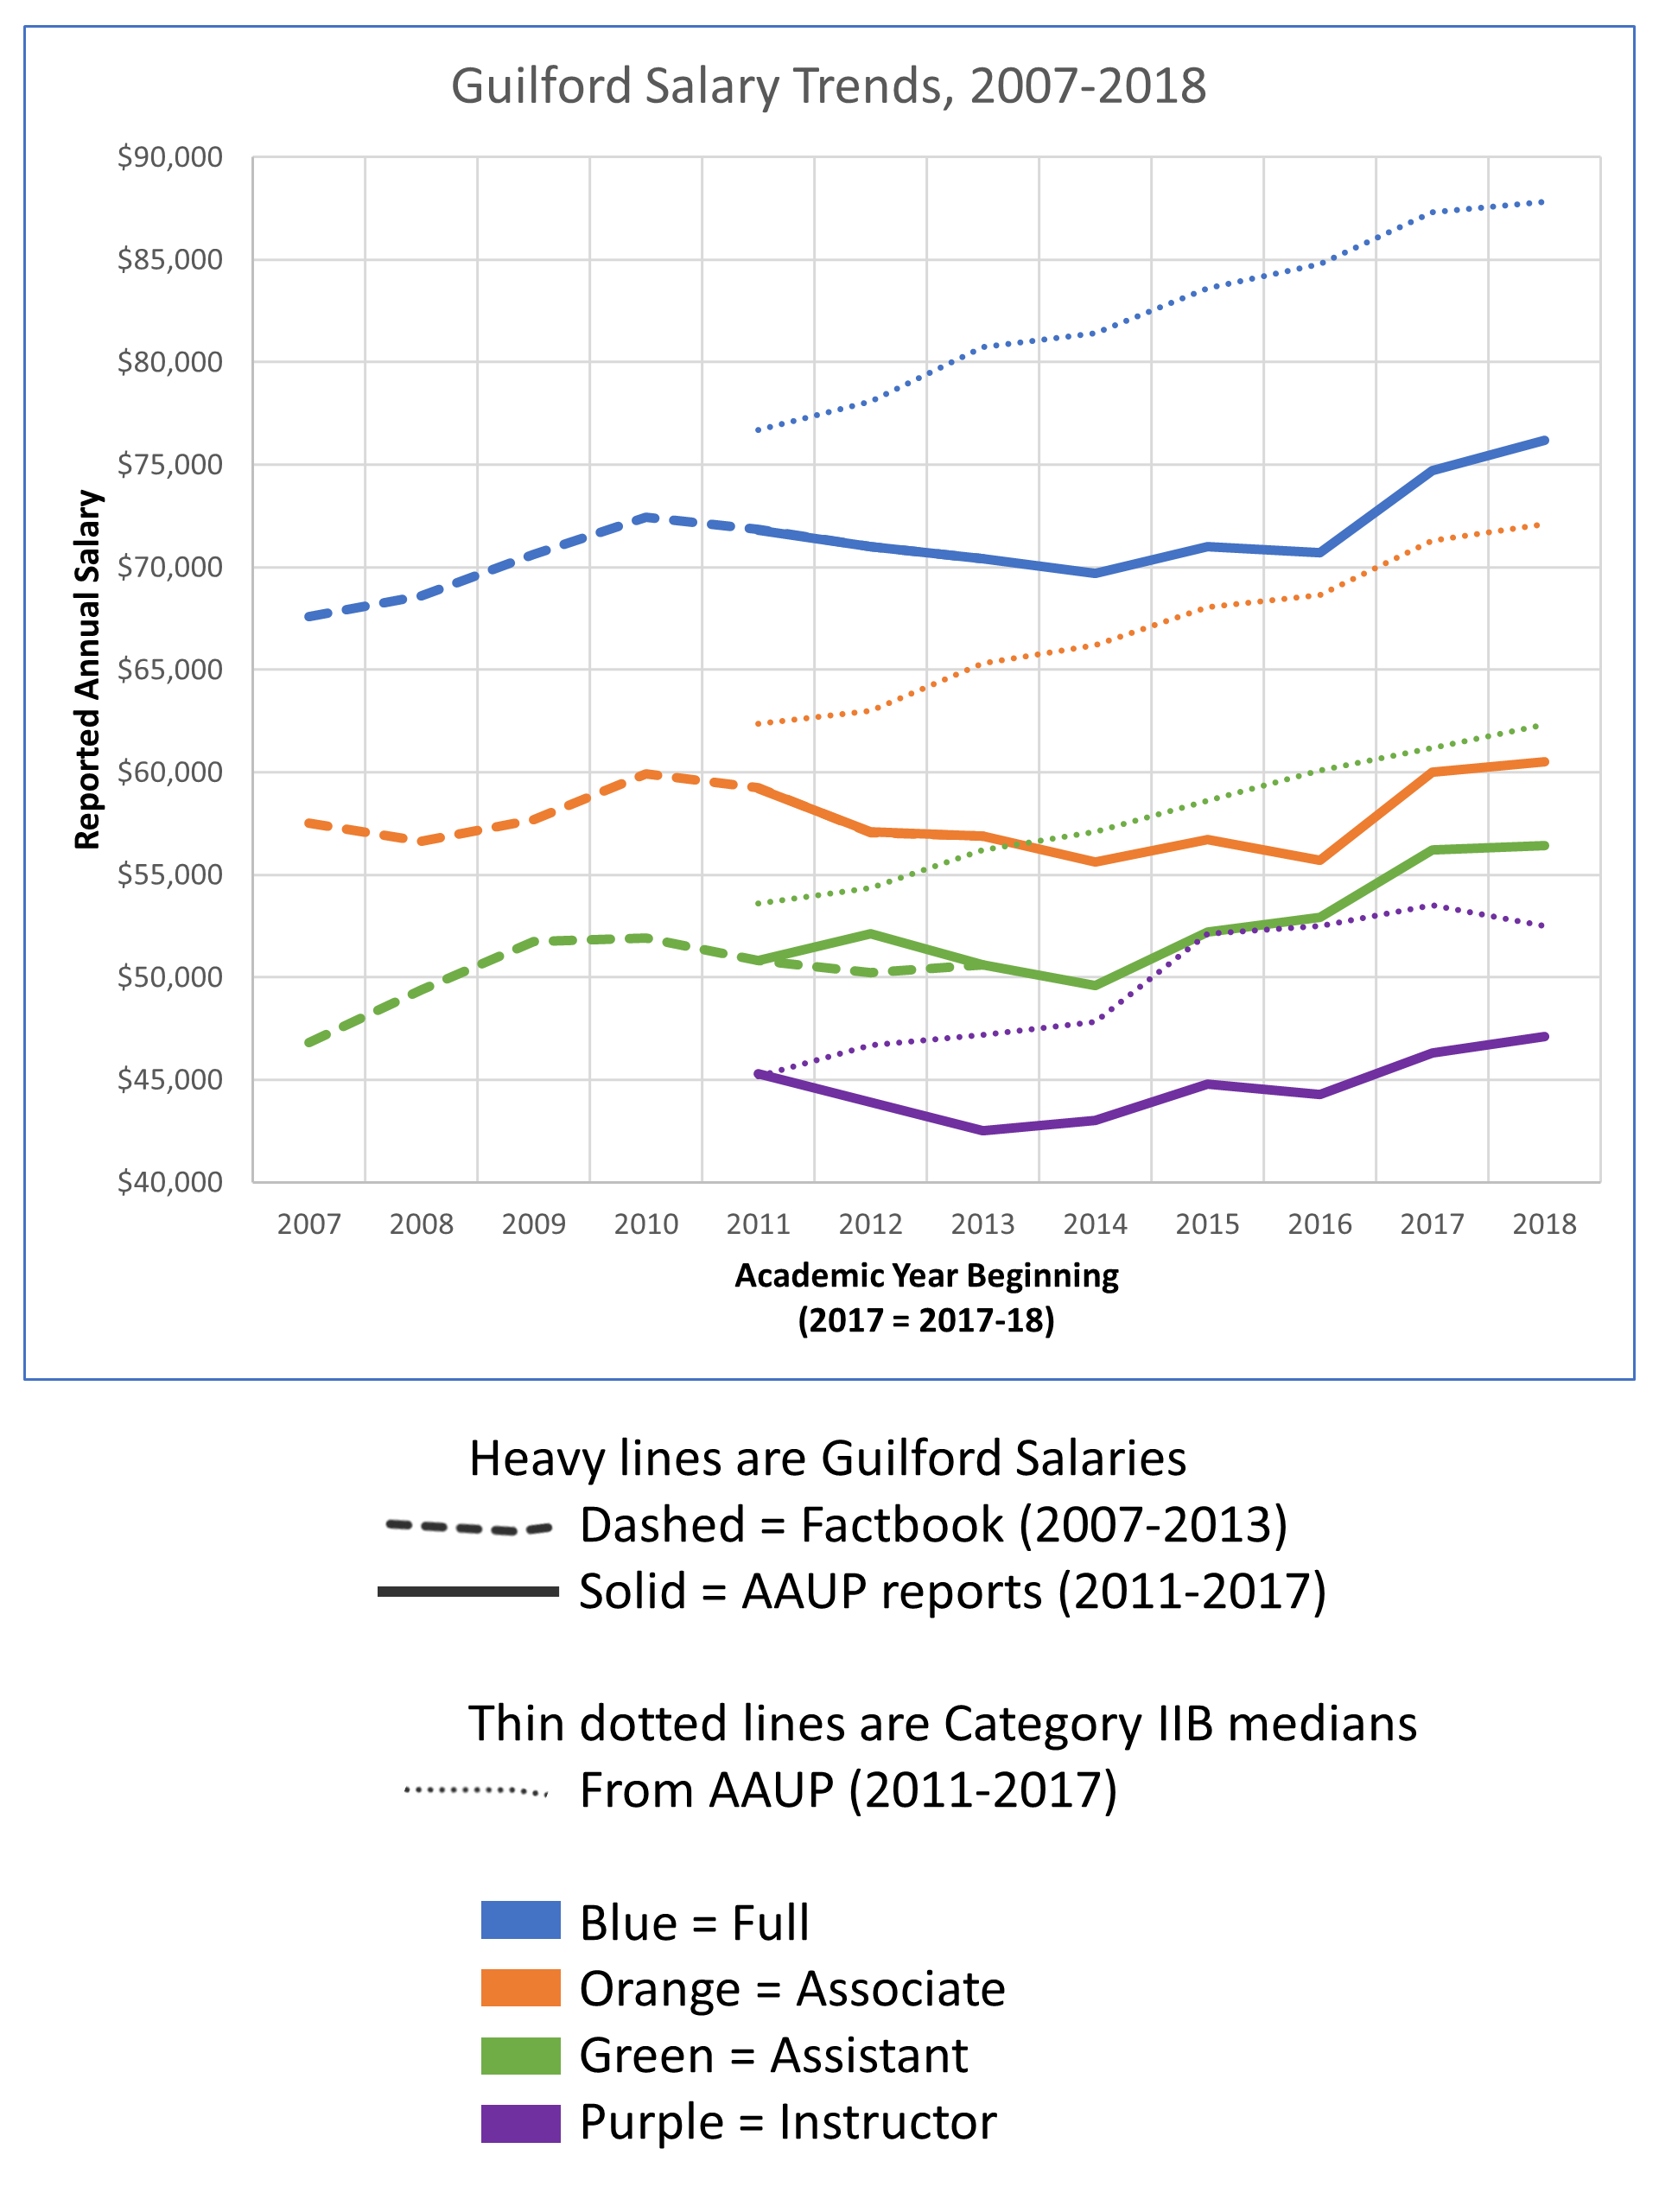
I’ve updated each graph I made for the earlier post. Those are below, with interpretation:
Here are my interpretations of the additional year of data. Please see the earlier post for a more complete analysis.
- Of the four ranks at Guilford tracked here (heavy solid lines), all showed a modest increase in 2018.
- Nationally, the AAUP median for Category IIB schools increased more than Guilford’s raises for Associate and Assistant, which means we lost some ground against the median of our peer group at those ranks. This is not a surprise given the small size of our raise pool last year.
- Nationally, the AAUP median for Category IIB schools increased less than Guilford’s raises for Full and Instructor, which means we gained ground against the median of our peer group at those ranks.
- For Instructors, our reported modest increase in salary contrasted with the drop in the national IIB median Instructor salaries.
- For Full Professors, our reported increase in salary coming in slightly stronger than the increase in the median may have to do with the large gaps full professors had from their targets, which meant they may have gotten more of the raise pool under our formula than others who were closer – i.e., we’re still pretty far behind our peers, but we filled in a little of the gap. I suppose we could have had fewer retirements or departures than other schools, also – we lost so many folks in 2016-17 that we have fewer left to lose now, which might have elevated our numbers somewhat relative to others. This is all speculation, though.
- Fundamentally, in 2018-19, we appear to have more or less kept pace with other IIB schools in terms of dollars, but we did not make progress on closing our sizable gaps with them except at Instructor rank, which we only did because of a national decline in Instructor pay. Though not the best outcome, this is better than period from 2010-2016, when we stagnated or even lost ground in real dollars (this was even worse if you take inflation into account, which was a total of about 10% over that period).
Here is the impact on our percentiles compared to other IIB schools:

Remember that these percentiles are tracking a different thing from the dollar values above. The percentiles are only about our ranking relative to other similar schools, while the first graph is raw dollars.
Here are my interpretations of the additional year of data on percentiles. Please see the earlier post for a more complete analysis of the history.
- At all ranks except instructor, we lost ground in terms of percentiles.
- This was most pronounced at Assistant rank, which grew more strongly nationally than other ranks.
- That means that, unlike 2017-18, when we made significant upward progress in our ranking, other schools passed us, although this didn’t wipe out all of the progress we made with the January 2017 raises.
- We are now back to similar percentiles from 2013, when we were already in the midst of our very steep decline, as opposed to our heyday in 2008-09, when we were still well below where we’d set our goals at the time but (unbeknownst to us) at easily the highest level we’d experience for the next decade.
- If we reach the stated goal of our compensation plan, we will be up near the 50th percentile for IIB, which is close to both the original Compensation Plan peer group of 46 schools and to the revised peer group of ~350 schools proposed this year.
Here are the raw numbers and last year’s percentage change in table form.
| Guilford | 2017-18 | 2018-19 | Percent change |
| Full | $ 74,700 | $ 76,200 | 2.0% |
| Assoc | $ 60,000 | $ 60,500 | 0.8% |
| Asst | $ 56,200 | $ 56,400 | 0.4% |
| Inst | $ 46,300 | $ 47,100 | 1.7% |
| IIB Medians | 2017-18 | 2018-19 | Percent change |
| Full | $ 87,300 | $ 87,800 | 0.6% |
| Assoc | $ 71,300 | $ 72,100 | 1.1% |
| Asst | $ 61,200 | $ 62,300 | 1.8% |
| Inst | $ 53,500 | $ 52,500 | -1.9% |
We need to have raises at least as big as last year’s not to lose ground. If we want to regain some of what we’ve lost, or even (heaven help us) reach our stated goal, we’ll need to have raises that average more like 4-5%.
Not all of that needs to come from new revenue. Every year we have some more senior, more highly compensated folks retire, and if they’re replaced, they are usually replaced with younger, lower-compensated folks, which creates room for raises for remaining faculty without adding to the overall budget.
That’s how I see it. Let me know if you have questions.